Duotone Photo Technique

Duotone Photos

I’ve been showing you how to use PowerPoint to quickly create stencil and lace effects. Now, let’s look at creating duotone photos. In addition to making a photo look very modern, duotone is a useful technique for using less than stellar photos.

Cat in the Kitchen

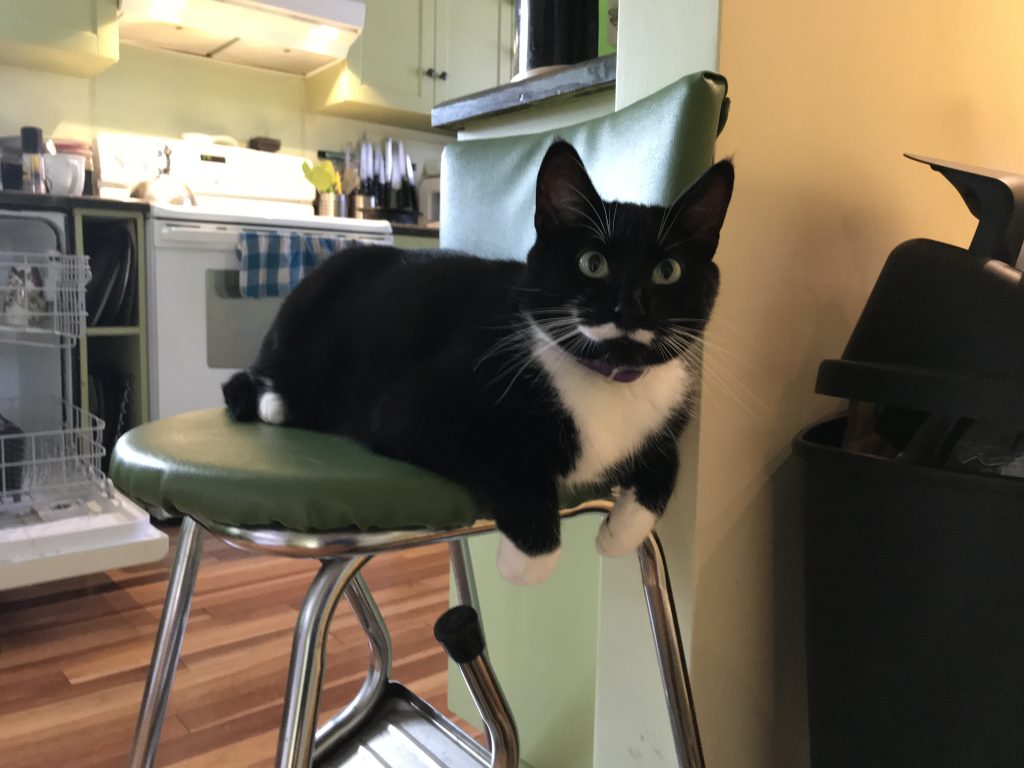
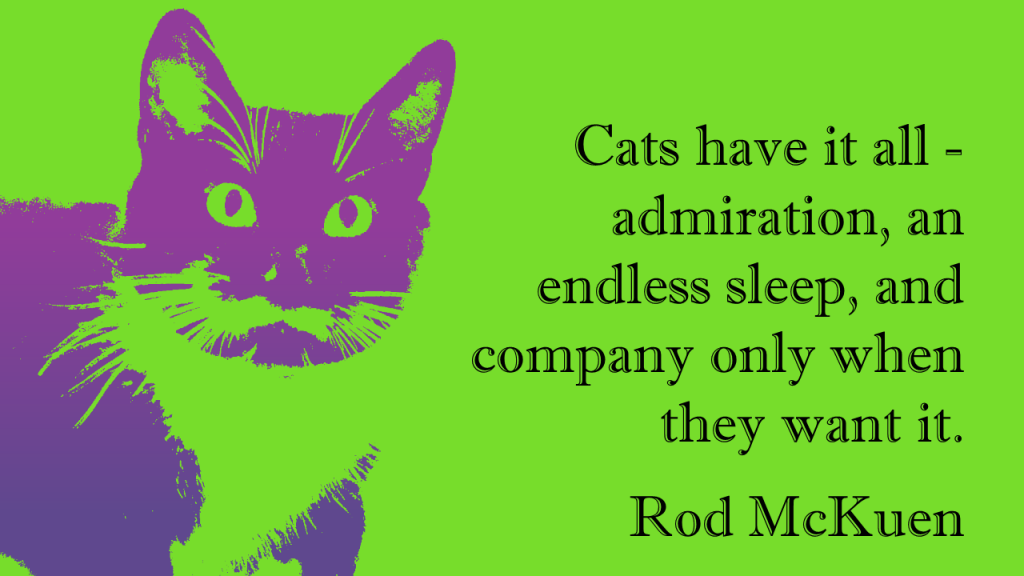
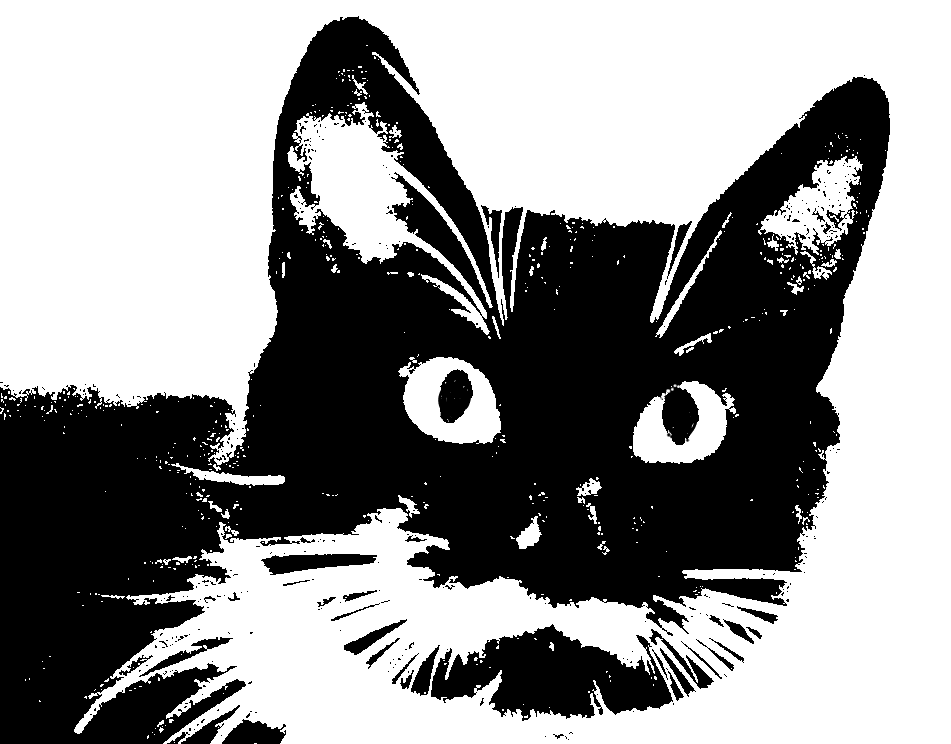
While the cat might be photogenic, the background is not. I want to move from the photo above to the duotone below, which is suitable for adding a quote.

So true

The first step is to crop the picture as closely as possible.

Just the handsome face here – no clutter

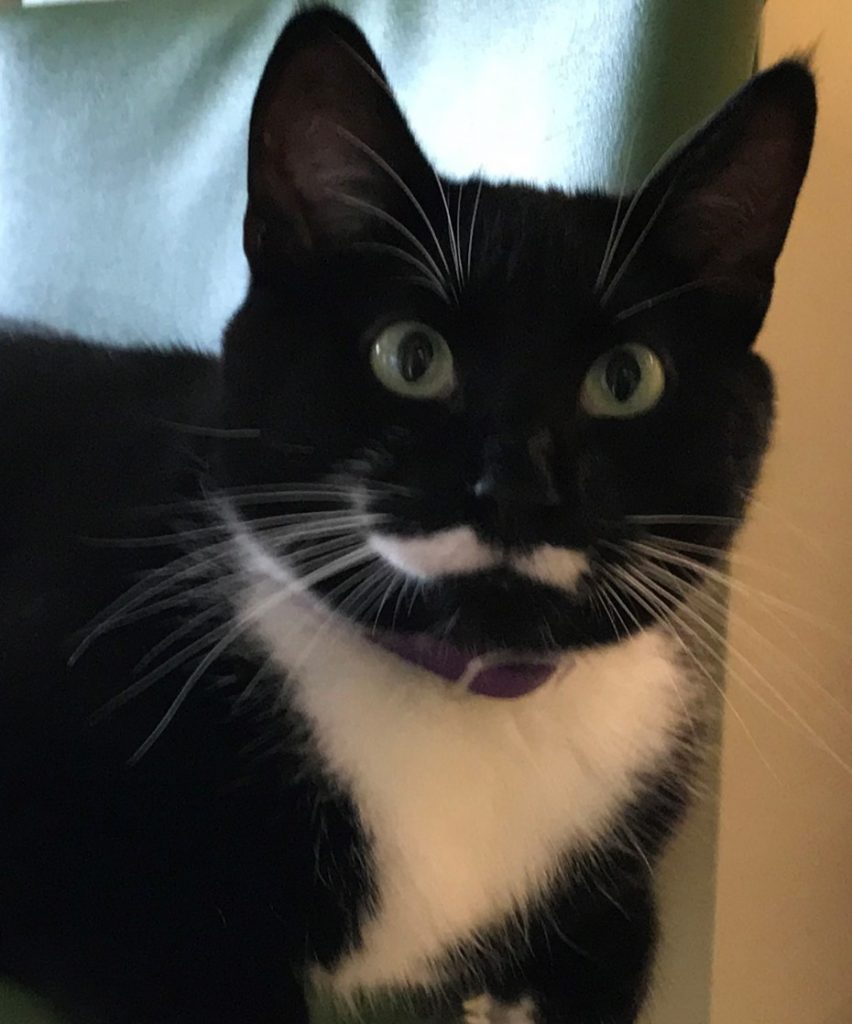
But unfortunately, once enlarged you see the photo is a little blurry. This won’t be a problem going forward and it shows how this technique can cope with less than perfect photos.

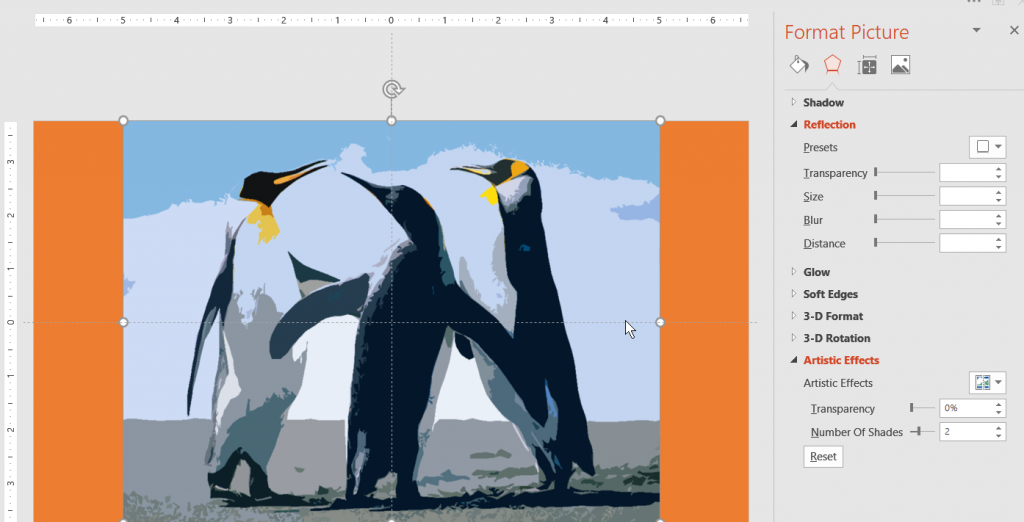
Going to Picture Corrections:
Brightness was set to 65%
Contrast to 100%

Picture Color: Saturation was set to zero.

The Adjusted Photo

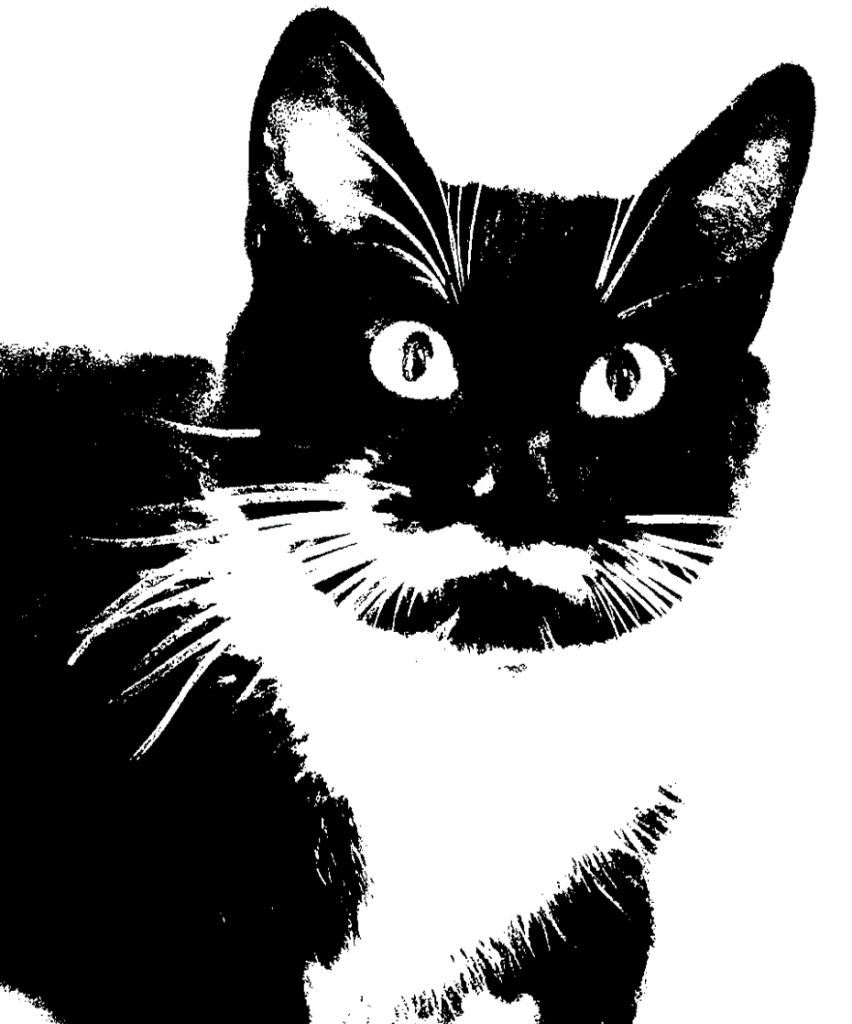
There is a bit of guesswork here, as I had to bring up Brightness enough to wash out the dark corner of the chair the cat is on, yet leave as much detail as possible. You’ll note that this brings out a lot of light spots on the pupils as well.

Why not just Recolor the picture to Black and White? In this case, I felt that recoloring removed too much detail from the photo. In the case of a different photo, recoloring might be the quickest and easiest method. I’d definitely try it first and see if I liked the results.

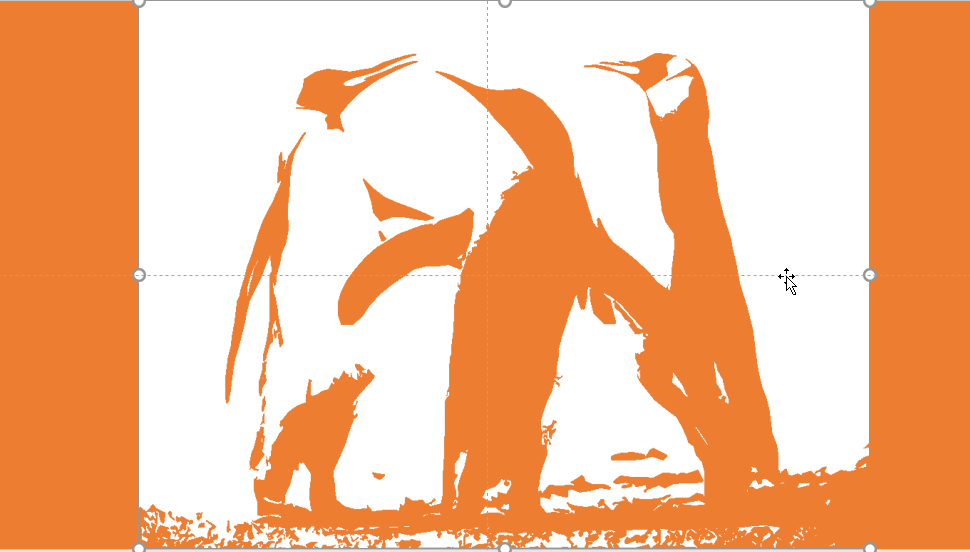
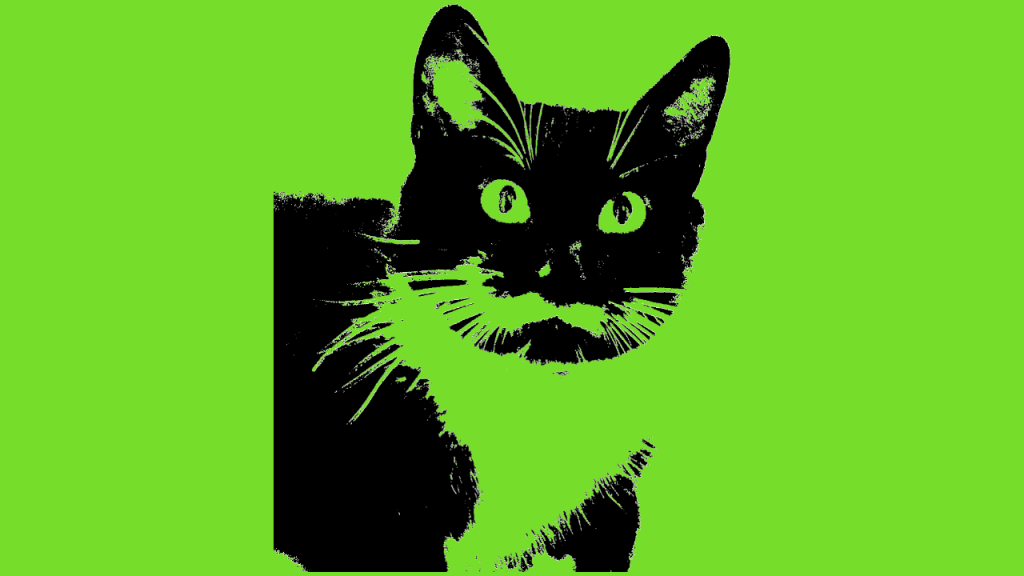
I’ve drawn a rectangle and filled it with a bright colour for contrast, this has been placed under the photo.

Now I can make the white portion of the photo transparent, by selecting Picture Tools>Format>Color>Set Transparent Color and clicking on a white portion of the picture.

The black portion of the photo remains.

What’s also hard to see in the above picture is that the photo has a lot of small grey artifacts in the borders of the fur. This is exactly what we added in when making the lace picture earlier, but here it is unwanted. An additional step is required for this photo (again for some photos it might be unnecessary).

But before I do that – I’m going to use the Ink command and touch up the pupils to remove some of the glints. Ink is only available in Office 365.

Showing Glint repair using ink tool.

After filling in the glints on the pupils, I grouped the ink layer with the photo. Then I copied and pasted the photo (and ink layer) as a picture. PowerPoint remembers all the photo editing done to a picture (which is why the Reset command works) and applies those steps cumulatively. I want to start fresh and apply the Recolor command to strip out the grey artifacts without losing a lot of detail. After recoloring the photo to 25% Black and White I set the White color to transparent

The same photo, but now with a crisper look

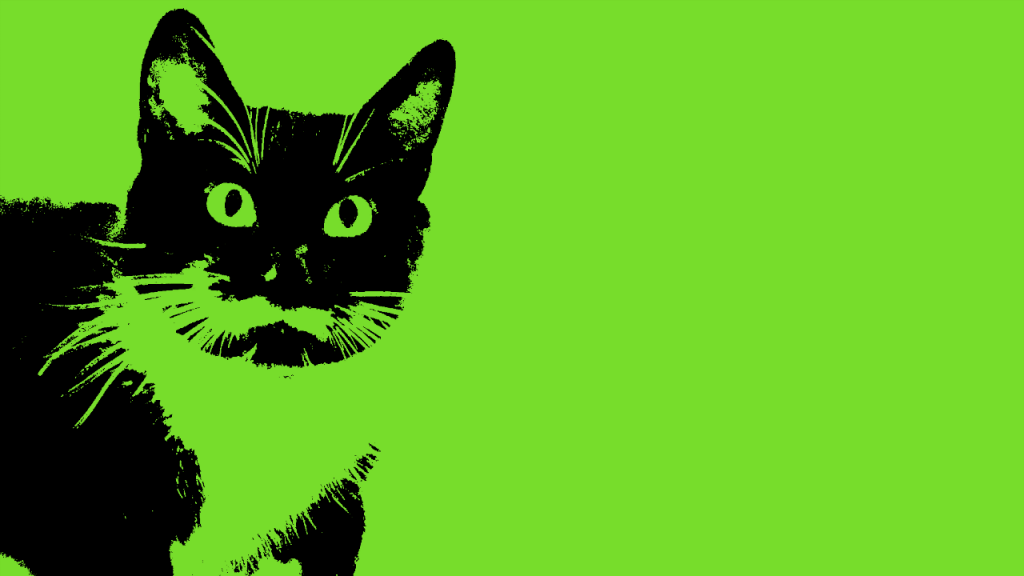
Again, I grouped the photo with bright background rectangle, pasted it as a picture and this time set the black portion as transparent. This is similar to the photo stencil.

Photo with transparent cat

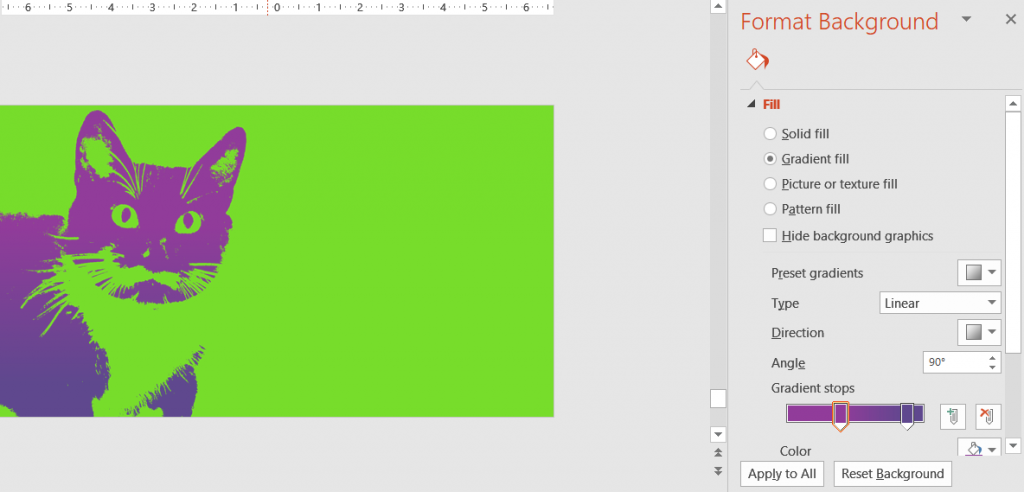
In the final step, set a gradient fill in your chosen colour scheme to colour the duotone.

Setting the background of the slide to colour the duotone

The main elements of this technique are applicable to a number of photo effects. Try them out and see what you get!


This post is originally from 2018 If you want help with the newest and classic features in PowerPoint drop me a line at catharine@mytechgenie.ca

Button Bar Chart

Simple or Complicated?

Simple or complicated? It’s been my observation that anyone can make a subject sound complicated – but it takes real understanding of a topic to simplify it in a way that is meaningful.

This is why, when I saw this sample slide below from designer Julie Terberg, I sat up and paid attention. Here is a wonderful example of a chart that is simple in a beautiful and useful way. Immediately, you can see that an audience would find this chart easy to read and understand

Julie Terberg’s Button Bar Chart from her #SlideADayProject project

I paid even more attention when I saw the way that Neil Malek put together an Excel version of the chart. Neil introduces a clever technique using shapes in data labels.

Unfortunately, Neil’s clever technique was only available in Office 2016. I wanted to build the chart in Office 2010, for the benefit of my clients still using 2010.

Button Bar Chart Slide, in PowerPoint 2010

I think that in the end, I succeeded. If you are interested in building this chart, and like me you are restricted to Office 2010, then I have a few pointers for you.

Button Bar Chart Pointers

  • Data Labels in 2010 can not use shapes. Instead, I tweaked the Shadow setting for the label, by setting the colour to match the fill on the label and the size to 150%. I left all other settings to zero. Shaping the label this way means that you can never achieve the circle that Julie used in her example. Instead, the best you can do is a lozenge shape. You can modify this when you change the font size in the label.
  • But once you’ve used the Shadow to enlarge your button, you can’t use it to shadow the data label. I solved this problem with an old fashioned solution. I made two charts (a 2016 and a 2017 chart). The two charts are grouped together. Each chart has a data label for the year and a data label for the shadow. In the example below those labels are using the 1 values. The column labelled 2016 value is the length of the bar.
Button Bar Chart Data layout
  • The Shadow column must proceed the 2016 column or your shadow will wind up on top of the 2016 label. Also format your labels in that order as well, or the shadow will temporarily be on top of the 2016 label.
  • Format your shadow and label to the same font size.
  • The Chart Element selector on the Format Tab of the Chart Tools ribbon is your friend. Its’ really the only reasonable way to select the shadow data labels once they are under the visible label.
  • Link the label text to the cell in in Excel by using the formula bar and typing in the linking formula to the cell. This allows you to update the chart, by changing the text in the cell. A bit finicky to set up; but it will save a ton of time in the long run.
  • The best way to take this chart into PowerPoint is by copying/pasting the chart – as an image. Which means that you’ll need to presize the chart in Excel, so that text is not distorted by resizing once it is pasted into PowerPoint. Again, its a bit finicky – but worth it.
  • In PowerPoint, I created a layout, with text placeholders on the left and bottom of the slide.

    Layout has text placeholders on left and bottom of slide

All in all, a pretty reasonable version of Julie’s stellar design.

If you want to follow Julie Terberg and Neil Malek on Twitter, you’ll find them here.


This post is originally from 2018. If you want help with the newest and classic features in PowerPoint drop me a line at catharine@mytechgenie.ca

Photo Stencils

Windows 10 default penguin photo

Duotone photos are the current thing online and you can buy software or use a service to convert your photos into duotone photos. But did you know that you can easily create duotone photos in PowerPoint?

Along the way to this technique, I’ll show you how to make stencils and lace out of your photos as well.

Stencils

Windows 10 default penguin photo

I’m going to use this photo of penguins to make a stencil type image. I’m using Office 365, but this can be done in PowerPoint 2010 as well. I’ve also changed the background colour of my slides. This isn’t necessary, but will make the images easier to understand.

After inserting the photo and changing the background colour, go to Picture Tools>Format>Artistic Effects. You can use either the Photocopy effect or the Cutout effect. The main difference will be the amount of small detail retained by the photo. I like the Cutout option with this photo.

Picture of penguins with Cutout Effect applied
The first step in creating a stencil, applying the Cutout Effect


Reduce the number of shades to 1

The Cutout now has a the number of shades reduced to zero

Select Picture Corrections and adjust Contrast to 100%

The contrast on the picture is now 100%

Select Picture Color and adjust Saturation to 0%

Saturation on the picture is now set to zero, removing the small blue highlights that were visible before.

Even if you are on Office 365, you’ll need to use the Ribbon. The Set Transparent Color command is not on the Picture Color Tab. Select Picture Tools>Format>Color>Set Transparent Color. Click on a black portion of the picture. Voila! A stencil of Penguins that takes on the colour of the slide background.

After the black portions of the picture have been removed, the slide background is visible.

You can use a variation on this technique to make a “lace” overlay.


This post is originally from 2018 If you want help with the newest and classic features in PowerPoint drop me a line at catharine@mytechgenie.ca

Three Presentation Mistakes

This is a reissue of an article I originally posted on March 7, 2019 on the WebGenii Consulting website. I think it will continue to be relevant for some time to come.


Last weekend I attended the Southern Alberta Library Conference. I really enjoy this conference, the speakers are great and the topics really relevant to my volunteer work with the Redcliff Public Library. So what does this have to do with presentation mistakes? It was interesting to see the kind of presentation mistakes that speakers who are good at presenting make.

Mistake Number 1

Our old friend – too much text on the slide. Even good speakers do this, even though they shouldn’t. I suspect because they worry about leaving something out of their presentation.

All the sentences, all the text
All the text, nothing missing. (Dummy text courtesy the Bacon Ipsum generator)

Once again, I’d like to join my voice to all the presentation experts telling you NOT to put all your text on the slide. But, I know it will happen anyway, so what can we do to improve a slide like this?

Remove Bullets

Bullet points add nothing
Same slide – fewer bullets

If you are going to write full sentences with punctuation, then bullets are completely unnecessary. They take the viewer’s eye away from the content of the sentence. Save bullet points for sentence fragments, which is what they are designed for.

One Sentence Per Slide

One sentence per slide
Give each Sentence its’ own slide

Help the audience focus its’ attention by restricting yourself to one sentence per slide at a time.

Position Sentence Text

Control Text Wrapping
Control text wrapping to effectively position your message

There is no rule in PowerPoint (or any presentation software) that requires you to use the default text wrapping. Add line breaks to force text to wrap for greater readability and easier recall. Notice how the ham jumps out from the rest of the text, when it is forced onto its’ own line. Think about the part of the sentence you wish to emphasize and add line breaks accordingly. Also, if the sentence is on its’ own slide, there will be room to do this.

Mistake Number 2

Smart Art can cause problems of its’ own. In particular, the seductive way it shrinks text to fit into the graphic makes people forget to edit. (See mistake number 1)

Smart Art can be a problem
Smart Art isn’t as smart as you think

Also, the default colour schemes means a lovely rainbow of colours. How is this a bad thing you ask? Well, inevitably you get a colour combination like point three in the graphic above. White text on a yellow background. That’s readable on a computer monitor, but when projected onto a screen it doesn’t have enough contrast.
The rainbow effect above, does something else as well. It wastes the potential usefulness of those colours. Colour is a great way of adding organization and hierarchy to a presentation. In the slide above, perhaps green refers to free-range meat, blue to fish, yellow to poultry, red to spicy foods, and I have no idea what pink would refer to. Because there is no organization being used here, just the random default applied by Smart Art.
Ignoring the organizational impact of colour, is like leaving money on the table.

Mistake Number 3

This last mistake is a little bit of mistake 1 AND mistake 2 combined, and it comes from using Smart Art process graphics like the one below:

Smart Art Process graphic
Here is a process with multiple steps and a lot of text.

Every time, a process graphic like this leads to the speaker saying “I know this is hard to read, but”. Hmmm, yes it IS hard to read, but I can understand the desire to help people understand the flow of a process. So why not introduce your process in a series of slides like this:

Showing a step in a process
Introduce your process in a series of slides.

In this sample slide I’ve taken the process and reduced to a smaller graphic in the top left corner. Here it will act as a map to show people where we are. I’ve toned down the colours of the steps that are not being talked about on this slide. I’ve left the bright blue alone, because we are talking about the blue step on this slide. I’ve cut out the blue step and enlarged it, so the text will be easier to read. It is easy to imagine each step in turn being featured on a separate slide and highlighted on the map.

Once again, thanks to everyone who spoke at the Southern Alberta Library Conference. I learn a lot about how to be a better library board member every time I attend. And, if you are a resident of Alberta; consider volunteering in your local library. It really is the best volunteer gig around. Such a positive environment that really makes a difference in the community!

I offer presentation design services and coaching. Feel free to send me an email.


My updated (November 2019) email address is: catharine@mytechgenie.ca